Description: You must install lm-sensors to add temp/fan sensors in the config.
sudo apt install lm-sensors sudo sensors-detect
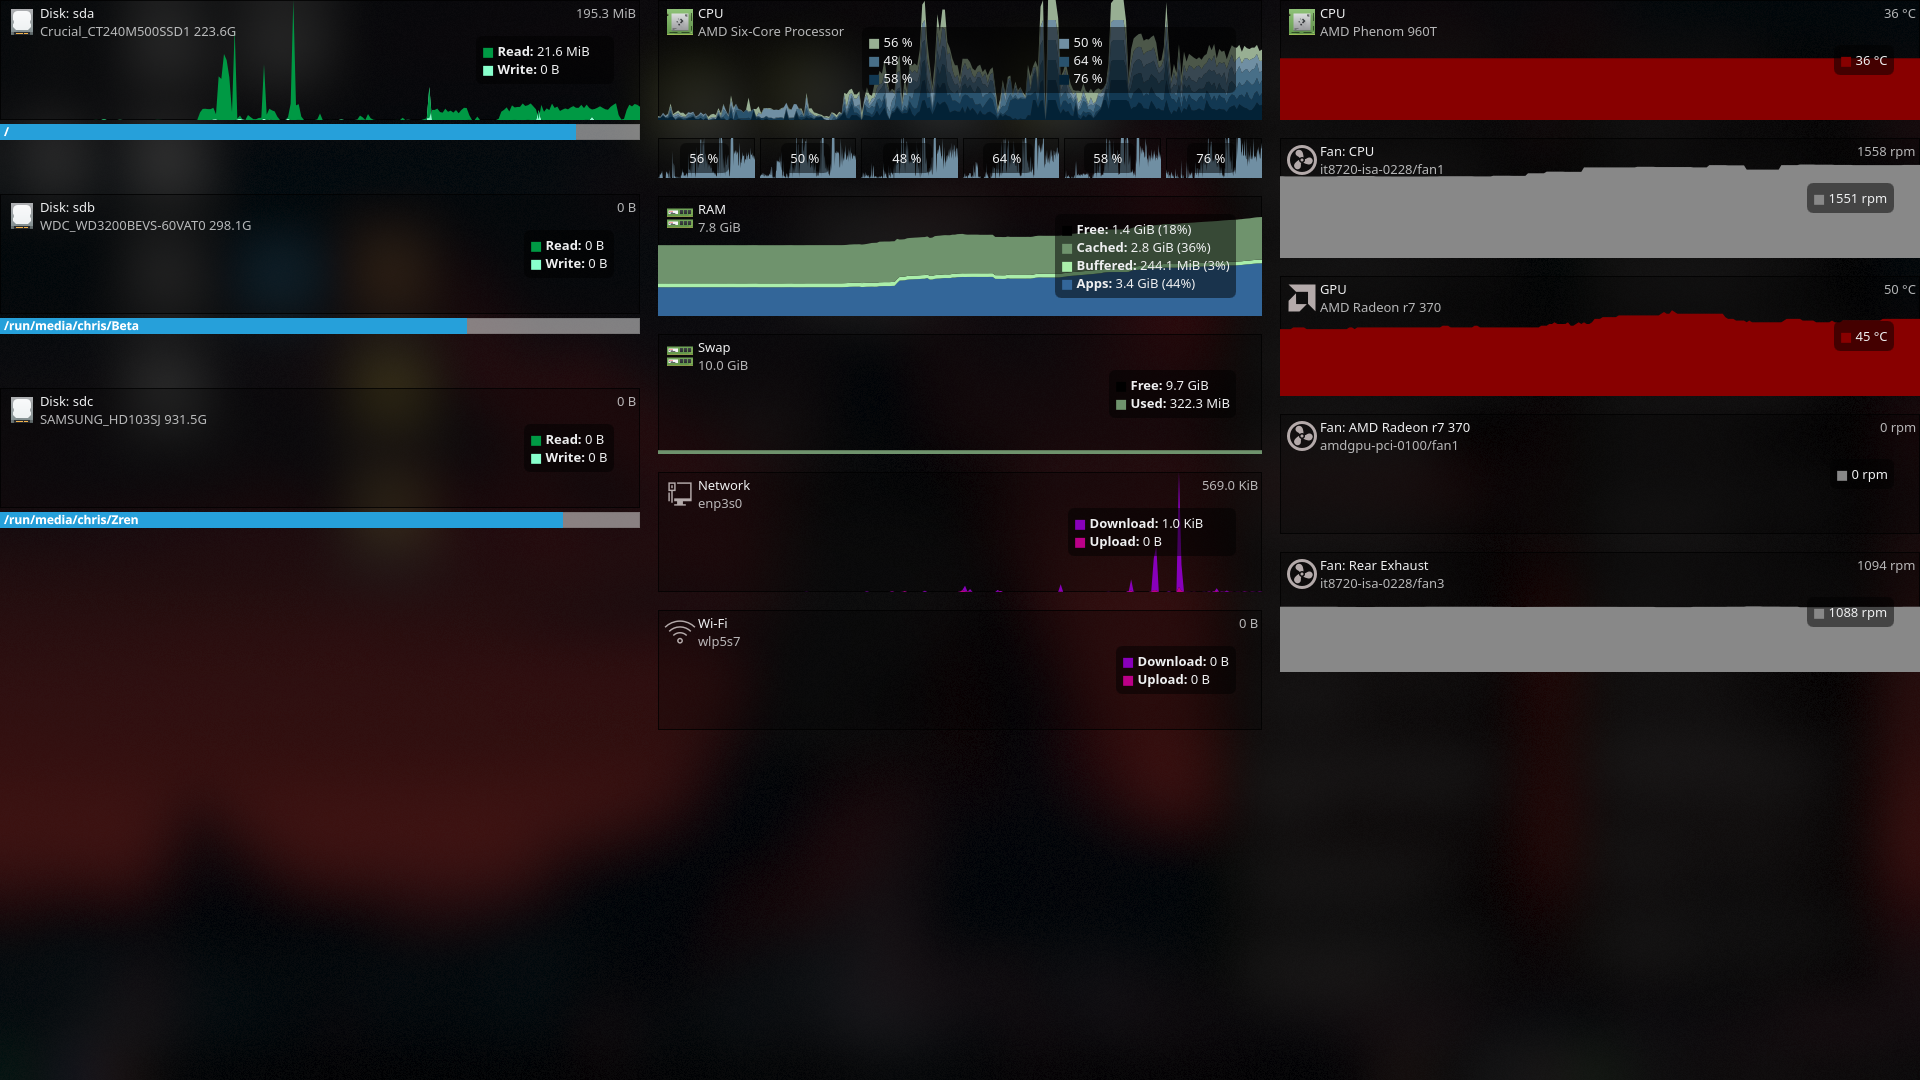
* Panel "icon" is an animated version of the KSysGuard icon that shows your current CPU usage. * Disk Drives are parsed from the command `lsblk --output-all --json`. * Uses the fullscreen popup window from the Application Dashboard widget. * Can quickly setup lm_sensors temp graphs and fan graphs in the right most column.Last changelog:
v4 - December 2 2019
* Fix bug when leaving "settings" config tab caused plasma to freeze. * Updated Dutch translation by @Vistaus (Pull Request #21)
I agree with this. It does the same with Kubuntu 22.04. Almost all thermal widgets does not able to connect the sensor in 22.04 except system monitor widgets.
8Hello. First I want to say that I love this dashboard! I just have one issue which I can't figure out. Sometimes when I log in the Dashboard has no temps or fan speeds (the sensors are there but no data). If I delete the icon for a sensor in the configuration, then it starts working. Is there a log or config file I can check for why that might happen?
Hi, I am having a problem with the network monitoring : I am connected to two networks (enp0s31f6 and wlp2s0), and there is a third one appearing on the dashboard (enp3s0, which doesn't exist anywhere but in this software). It's indicators are always 0, and it takes space for nothing.
I found out that the name of this virtual network was hard-coded into the file 'contents/ui/SensorData.qml'. Once I removed the line, the panel disappeared (after reboot). So I guess my problem is solved.
How do I use this to view, in a panel, real-time CPU and bandwidth resources on a remote computer ?
I normally use the Trinity desktop (i.e., more or less, KDE3) and am looking to move to the current version of KDE, but I need to be able
to run several widgets monitoring resources on remote systems. In KDE3/Trinity this is easy using the "System Guard" widget, but I don't see how to do it in KDE/plasma 5. This seems like the right widget, but maybe I'm wrong and there's another one that I need to install to do the job?
I don't think it's possible to monitor remote sensors with my widget, but KSysGuard can. I've broken in down here:
https://github.com/Zren/plasma-applet-sysmonitordash/issues/23
> KSysGuard can monitor remote KDE installations.
> https://docs.kde.org/trunk5/en/kde-workspace/ksysguard/ksysguard.pdf
Yes, ksysguard is what I use in Trinity(KDE3). But I can't see how to put ksysguard in a panel in KDE5 :-( That inability is what led me to look for a different widget, which is when I found yours.
Hi, this causing Plasmashell crash on Debian 10.2 with Plasma 5.14.5 when in configuration window you go in "settings" and try to go back then in "networks" or "sensors".
There should be a Dr Konqi icon in the system tray, can you save the stack trace / dev info and upload it in a new issue on GitHub?
https://github.com/Zren/plasma-applet-sysmonitordash/issues
Sorry, didn't see you're 1st question, was aways from home. i used "crash" term because of the need to restart Plasma, sorry. Anyway, glad you find the problem and fix it in a few. Good job ;)
Can't seem to get it to show anything except whatever the default unlabeled graph is. No matter what sensors I add, it's still just the default graph. No idea how to change anything.
Can you take a screenshot with the "Spectacle" app (use the delay feature) and upload it to imgur.com. Paste the url to the image here. Are you using v2 or v3 of the widget? What GPU are you using (AMD / Nvidia / Intel)?
Well, nevermind. I was very confused about how this widget worked. It's working as intended. I didn't realize that you needed to click on the widget to show the graphs. Sorry about that.
Man, this can be the best system monitor ever, but it has some bugs, in my system, it show 3 network adapter when only one is the one I am using in fact, and it does not fit well in my 1366x768 monitor, it needs a scroll on the columns for this
I've installed and use System Monitor Dashboard for a few days. I've been testing it's functionality and usefulness on several of my systems. While I like and think well of it, I've been assembling a list of nits, suggestions and wants. How would you like me to push these to you? I'm reluctant to enter a single large long post with multiple subjects.


Ratings & Comments
49 Comments
The issue of getting sensors in Kubuntu 22.04 should be solved.
Hi, Very nice widget. The only thing I can't find how to configure is the update speed of the sensors. It would be nice to set them to 1 second
Please update for 22.04 LTS, no sensors populate the list when you try to add them.
I agree with this. It does the same with Kubuntu 22.04. Almost all thermal widgets does not able to connect the sensor in 22.04 except system monitor widgets.
the best of all in doubt, it just needs to work on ubuntu 22.04 Lts :(
10 10 the best
8 Hello. First I want to say that I love this dashboard! I just have one issue which I can't figure out. Sometimes when I log in the Dashboard has no temps or fan speeds (the sensors are there but no data). If I delete the icon for a sensor in the configuration, then it starts working. Is there a log or config file I can check for why that might happen?
Hi, I am having a problem with the network monitoring : I am connected to two networks (enp0s31f6 and wlp2s0), and there is a third one appearing on the dashboard (enp3s0, which doesn't exist anywhere but in this software). It's indicators are always 0, and it takes space for nothing.
I found out that the name of this virtual network was hard-coded into the file 'contents/ui/SensorData.qml'. Once I removed the line, the panel disappeared (after reboot). So I guess my problem is solved.
Weird. It shouldn't be creating a network graph if the network id doesn't exist. I'll remove that harcoded id though. Nice catch.
How do I use this to view, in a panel, real-time CPU and bandwidth resources on a remote computer ? I normally use the Trinity desktop (i.e., more or less, KDE3) and am looking to move to the current version of KDE, but I need to be able to run several widgets monitoring resources on remote systems. In KDE3/Trinity this is easy using the "System Guard" widget, but I don't see how to do it in KDE/plasma 5. This seems like the right widget, but maybe I'm wrong and there's another one that I need to install to do the job?
I don't think it's possible to monitor remote sensors with my widget, but KSysGuard can. I've broken in down here: https://github.com/Zren/plasma-applet-sysmonitordash/issues/23
> KSysGuard can monitor remote KDE installations. > https://docs.kde.org/trunk5/en/kde-workspace/ksysguard/ksysguard.pdf Yes, ksysguard is what I use in Trinity(KDE3). But I can't see how to put ksysguard in a panel in KDE5 :-( That inability is what led me to look for a different widget, which is when I found yours.
7 7 good (why i can't set custom script who return int value for dysplay values on chart in third column?)
Hi, this causing Plasmashell crash on Debian 10.2 with Plasma 5.14.5 when in configuration window you go in "settings" and try to go back then in "networks" or "sensors".
There should be a Dr Konqi icon in the system tray, can you save the stack trace / dev info and upload it in a new issue on GitHub? https://github.com/Zren/plasma-applet-sysmonitordash/issues
Plasma wasn't crashing due to a segfault, but freezing due to an infinite loop. v4 of the widget should fix that bug.
Sorry, didn't see you're 1st question, was aways from home. i used "crash" term because of the need to restart Plasma, sorry. Anyway, glad you find the problem and fix it in a few. Good job ;)
Can't seem to get it to show anything except whatever the default unlabeled graph is. No matter what sensors I add, it's still just the default graph. No idea how to change anything.
I just want to add that I don't really have any issues adding sensors manually to other monitor widgets.
Can you take a screenshot with the "Spectacle" app (use the delay feature) and upload it to imgur.com. Paste the url to the image here. Are you using v2 or v3 of the widget? What GPU are you using (AMD / Nvidia / Intel)?
Well, nevermind. I was very confused about how this widget worked. It's working as intended. I didn't realize that you needed to click on the widget to show the graphs. Sorry about that.
Man, this can be the best system monitor ever, but it has some bugs, in my system, it show 3 network adapter when only one is the one I am using in fact, and it does not fit well in my 1366x768 monitor, it needs a scroll on the columns for this
9 +Definitely of interest!
I've installed and use System Monitor Dashboard for a few days. I've been testing it's functionality and usefulness on several of my systems. While I like and think well of it, I've been assembling a list of nits, suggestions and wants. How would you like me to push these to you? I'm reluctant to enter a single large long post with multiple subjects.