


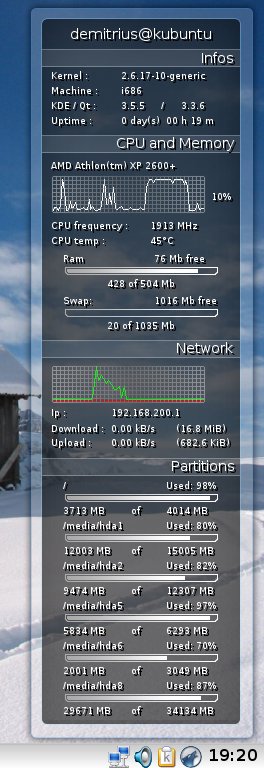
Evolution Task Theme (for Karamba)
L0rclA5CII


Source (link to git-repo or to original if based on someone elses unmodified work):
Version 0.3.2:
- Added 'binfmt_misc' to partition ban list
- Fixes 'interval' variables for low CPU usage
- Change encoding to iso-8859-1 for correct degree symbol
Version 0.3.1:
- Fix maindata.xml and theme skz file
- Added 'securityfs' and 'debugfs' to partition ban list [robinp]
- Modified KDE version print [robinp]


Other Karamba & Superkaramba:

Ratings & Comments
37 Comments
really nice :D
Ya, the memory display isn't accurate. On mine, the usage displayed is about 200 mb higher than it actually is.
i think its right because glassmonitor shows you the cache too ;)
i would like to second request for ram issue . i know i have 1.5 gig ram i can not possibly use 1.2 gig while surfing kde look . it seems common on many these theme monitors . other than that its most perfect theme . simple clean and just does its job . wonderful work in time when there is sometimes just too much eye candy everywhere . thank you for your work .
The only complain I have (apart from missing top processes info) is that it displays RAM always almost maxed out, when I know it's not so (and Aero AIO displays it correctly). The same "bug" is present in lots of other karamba system monitors... can something be done about this?
The only complain I have (apart from missing top processes info) is that it displays RAM always almost maxed out, when I know it's not so (and Aero AIO displays it correctly). The same "bug" is present in lots of other karamba system monitors... can something be done about this?
What about adding top processes information, like karamTop? http://www.kde-look.org/content/show.php/karamTop?content=13140
This design is superb. The look and feel is excellent and unlike others i've tried everything on my setup is detected automatically. The only negative is i have nothing showing in CPU temp. Am i missing something needed?
i have the same problem. what should i do?
http://havoc.ehet.net/pics/monitor%20bug.png My CPU speed is out of layout, second temperature is not shown and it's in middle of cpu freq. I would lke to use /proc/acpi/thermal_zone/THRM/temperature to see my temperature, how can I alter those two?
best and only karmba theme I use *thumbs up
Is this a bug? I've just insert my flash-drive http://st1.risunok.net/13633/bugscr1.png
After restarting X-server It's all OK now.
Hi, how i can configure this theme ? i want change network, because this theme don't display anything abaut connection. Jkorzeniak
Let me answer this, since I just figured out how. In fact, .skz is a regular zip file (<S>uper<K>aramba<Z>ip, I assume??) Just unzip it, edit, zip it back. I just replaced eth0 to ath0 and I have a monitor for wireless now. Yey! Just in case you are not UNIX savvy: * To find which files include the string eth0: grep -r eth0 * * Search and replace in vim: :%s/eth0/ath/gc Good luck :)
Ooops! I had a typo... The correct one is: :%s/eth0/ath0/gc Sorry.
i would add rpc_pipefs
I like your theme very much, but: 1. My CPU has a dynamic clock, but the CPU Frequenzy is not updated until I do rmb -> reload theme 2. Network: the network graph shows always full traffic, it doesn't matter if I have 250 kBit or 8000 kBit, it always show the same (but numbers are correct) 3. Partitions: on mounted network partitions (samba), it shows: X MB of Y MB, used X/Y % , but the bar is empty. Thanks,
/proc/sys/fuse/connections (fusectl) and /var/lib/nfs/rpc_pipefs (rpc_pipefs) are showing up in my partitions list. Really, everything in `grep ^nodev /proc/filesytesms` should be added to partition_fsban. Also, the CPU frequency looks wrong on my HT unless I change it to text x=129 y=85 sensor=program program="sed -n -e '/cpu MHz/{s/.*: //;s/\..*/ MHz/;p;q}' /proc/cpuinfo" interval=120000 There's a lot of places in your theme where many cats and greps and seds and awks could be optimized away. See "Useless Use of *" (http://www.netmeister.org/misc/useless_use.pdf).
How can I change the display of my partitions? I have partitions of 70Gb, 25Gb and 175Gb and they are showing as 70Mb, 25Mb etc...
I also have the problem with the CPU Temperature only displaying "°C" without number. Furthermore, I have a Pentium 4 with Hyperthreading, which is displayed twice - most likely there is the same problem with real core duo processor. Now the second processors display text mixes / overlaps with the CPU Temperature text.
Here's a screenshot of it: http://img412.imageshack.us/img412/9923/scrshothd5.png Another question: How can I configure GlassMonitor ? I'd especially like to change the update interval for the network statistics, because the amount of transferred data is not updating every second like the speed graph does, and I'd like it to do so.
I've got the same problem here. There is a bit C, but no Number in front of it. First I thought, the kernel-modules for graping the sensor-info was wrong installed or any package is missing. But I checked it and it must be some kind of information transport problem or a variable doesn't fit or the GlassMonitor tries to read-out the wrong sensor ... I would be happy about any Idea, to solve this problem! :) Thanks anyway for your effort! jeschliep
Hi, thanks for this wonderful theme but i still had a problem with cpu temp its just appear *c ....plz tell me what is wrong ...bec i saw in the screenshot a Working cpu temprature! thanks
Nice and useful theme. I`ve depreceated gkrellm. Great Job!!Go Ahead